VCE, or Vehicle Carbon Emitted, is the next step for any transportation emissions reduction program that makes use of the VMT strategy. VCE proposes taking the current VMT strategy a step further by calculating carbon emissions accurately by including the exact vehicle driven (year, make and model), the grade in the road, traffic along a specific route, and the number of starts and stops the vehicle will do. After all, the real culprit is the carbon emissions so we might as well account for the exact thing that matters. This sounds prohibitively complex, but we now have enough data and the computational capability to be able to achieve this.
What is VMT?
Vehicle Miles Traveled, or VMT, is a transportation metric widely used by cities and trucking regulators to estimate carbon emissions. Transportation emissions reduction programs with VMT aim to increase the costs for miles traveled in personal/individual vehicles (through gas taxes, dynamic bridge tolls, parking restrictions, etc.) while simultaneously incentivizing the use of alternate transportation options (buses, carpools, bicycling, etc.)
As an example, Los Angeles has the citywide goal of at least 5% VMT reduction from 2012 levels by 2025, and 10% by 2035. That comes to 0.4% VMT reduction per year.
But VMT has its shortcomings.
Why introduce a new KPI?
An evaluation by the Victoria Transport Policy Institute emphasizes that VMT is an objective, not a goal, meaning that it’s one of many approaches to lowering emissions. That is an important distinction. VMT is not meant to be a panacea. But it is an imperfect rubric, and the actions it inspires are not always the best way to reduce emissions.
Here are a few of the limitations:
Not all miles are created equal. Vehicle emissions depend on how fast you go on a road and whether the road has an incline. A car traveling at 50 mph will emit 4X the emissions as the same car traveling at 25 mph for an equal distance. A car going up a grade will emit exponentially higher emissions than one traveling a flat road. The distance traveled is only one of many key factors that influence vehicle emissions.
Not all cars are created equal. Hybrid and electric vehicles are more efficient in city driving, whereas conventional ICE vehicles are more efficient in highway driving. With the increase in the number of hybrid and electric vehicles on the road, using VMT alone becomes increasingly inaccurate. A 2013 study by the U.S. Department of Energy points to the fact that the VMT model doesn’t allow for inputs such as the battery range of electric vehicles. Given that EVs and hybrids perform more efficiently than regular cars and produce less emissions, VMT has a blindspot when it comes to EV travel.
Public transit isn’t always greener. Depending on the bus route, size, and the number of passengers, a bus might actually emit more from A to B than travel by car. So, opting for the bus doesn’t necessarily translate to a lower carbon impact.
In short, driving fewer miles does not always lead to reduced carbon emissions.
VCE: the next metric for carbon reduction
VCE is different from VMT in that it proposes to accurately account for exact carbon emissions by considering the vehicle make and model, the grade, the traffic, and the number of stops along the route.
This level of accuracy has been nearly impossible to achieve until now given the wide variance in the number of vehicles on the road and constantly changing road driving conditions. Ann Arbor-based GreenRoute Technology, spun out of the automotive industry, combines 20 years of different vehicle powertrain modeling experience with state-of-the-art route intelligence (including grade). As a result, they can weigh all of the factors above and identify the most energy-efficient route every time. They call this route, eponymously, the GreenRoute.
A country-wide study of different cities and types of vehicles shows that choosing GreenRoute can lower emissions by 15% and miles traveled by 18% for the same number of trips taken. By calculating carbon emissions with such heightened accuracy, GreenRoute effectively removes the need to use vehicle miles traveled as a proxy for emissions.
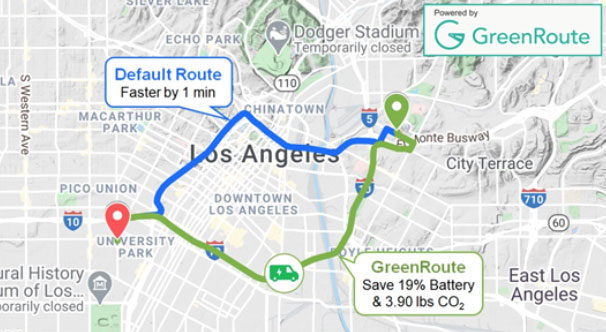
A trip from downtown Ann Arbor to the north side. The GreenRoute (in green) is the more fuel-efficient route than the default route (in blue).
Cities looking to reduce their transportations emissions need a more acute understanding of carbon emissions, down to each individual ride, and the type of vehicle making the ride. A city using GreenRoute for its operational fleet can reduce emissions by 15% without driving less or making the large capital investment to change the vehicles.
GreenRoute is the key to VCE
VMT is seen as just one aspect of a larger plan to reduce emissions. Similarly, GreenRoute would be most effective when paired with a host of other public policy initiatives, including those focused on reducing congestion. While GreenRoute can offer alternate routes and possibly reduce congestion on certain roads, it does not have the ability to reduce the number of cars on the road overall.
The value of GreenRoute can be expanded to identify the real carbon impact of different routes to your destination, whether by public transit, bicycle, or car. It leaves clear, predictive decision-making up to the individual. Taken together with real-time traffic, transit schedules, parking availability, weather, and local city activities linked to transportation use, GreenRoute gives people the means to make informed, in-the-moment choices that can reduce their energy use.
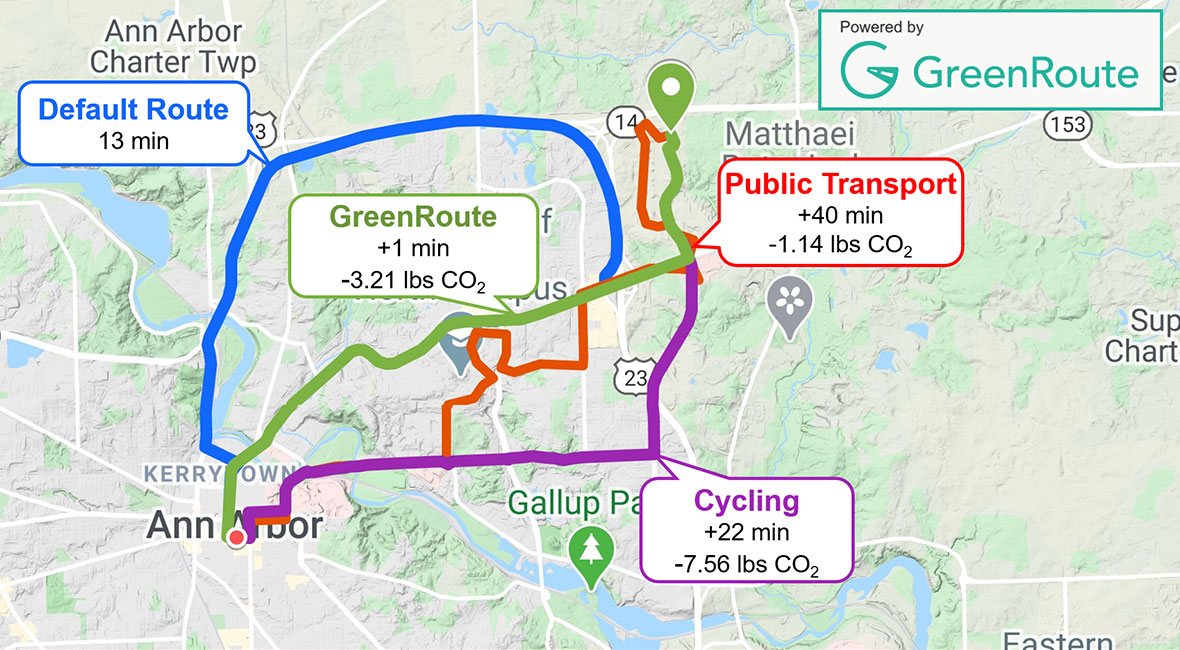
These 4 alternate paths offer a fuller picture of carbon emissions. While the GreenRoute adds 1 minute to the default car route, it emits 3.21 lbs less carbon. It also emits less carbon than public transit.